글의 목적
- Apexcharts가 뭔지 알 수 있다.
- 리액트에서 차트 그림을 빠르게 그려보자.
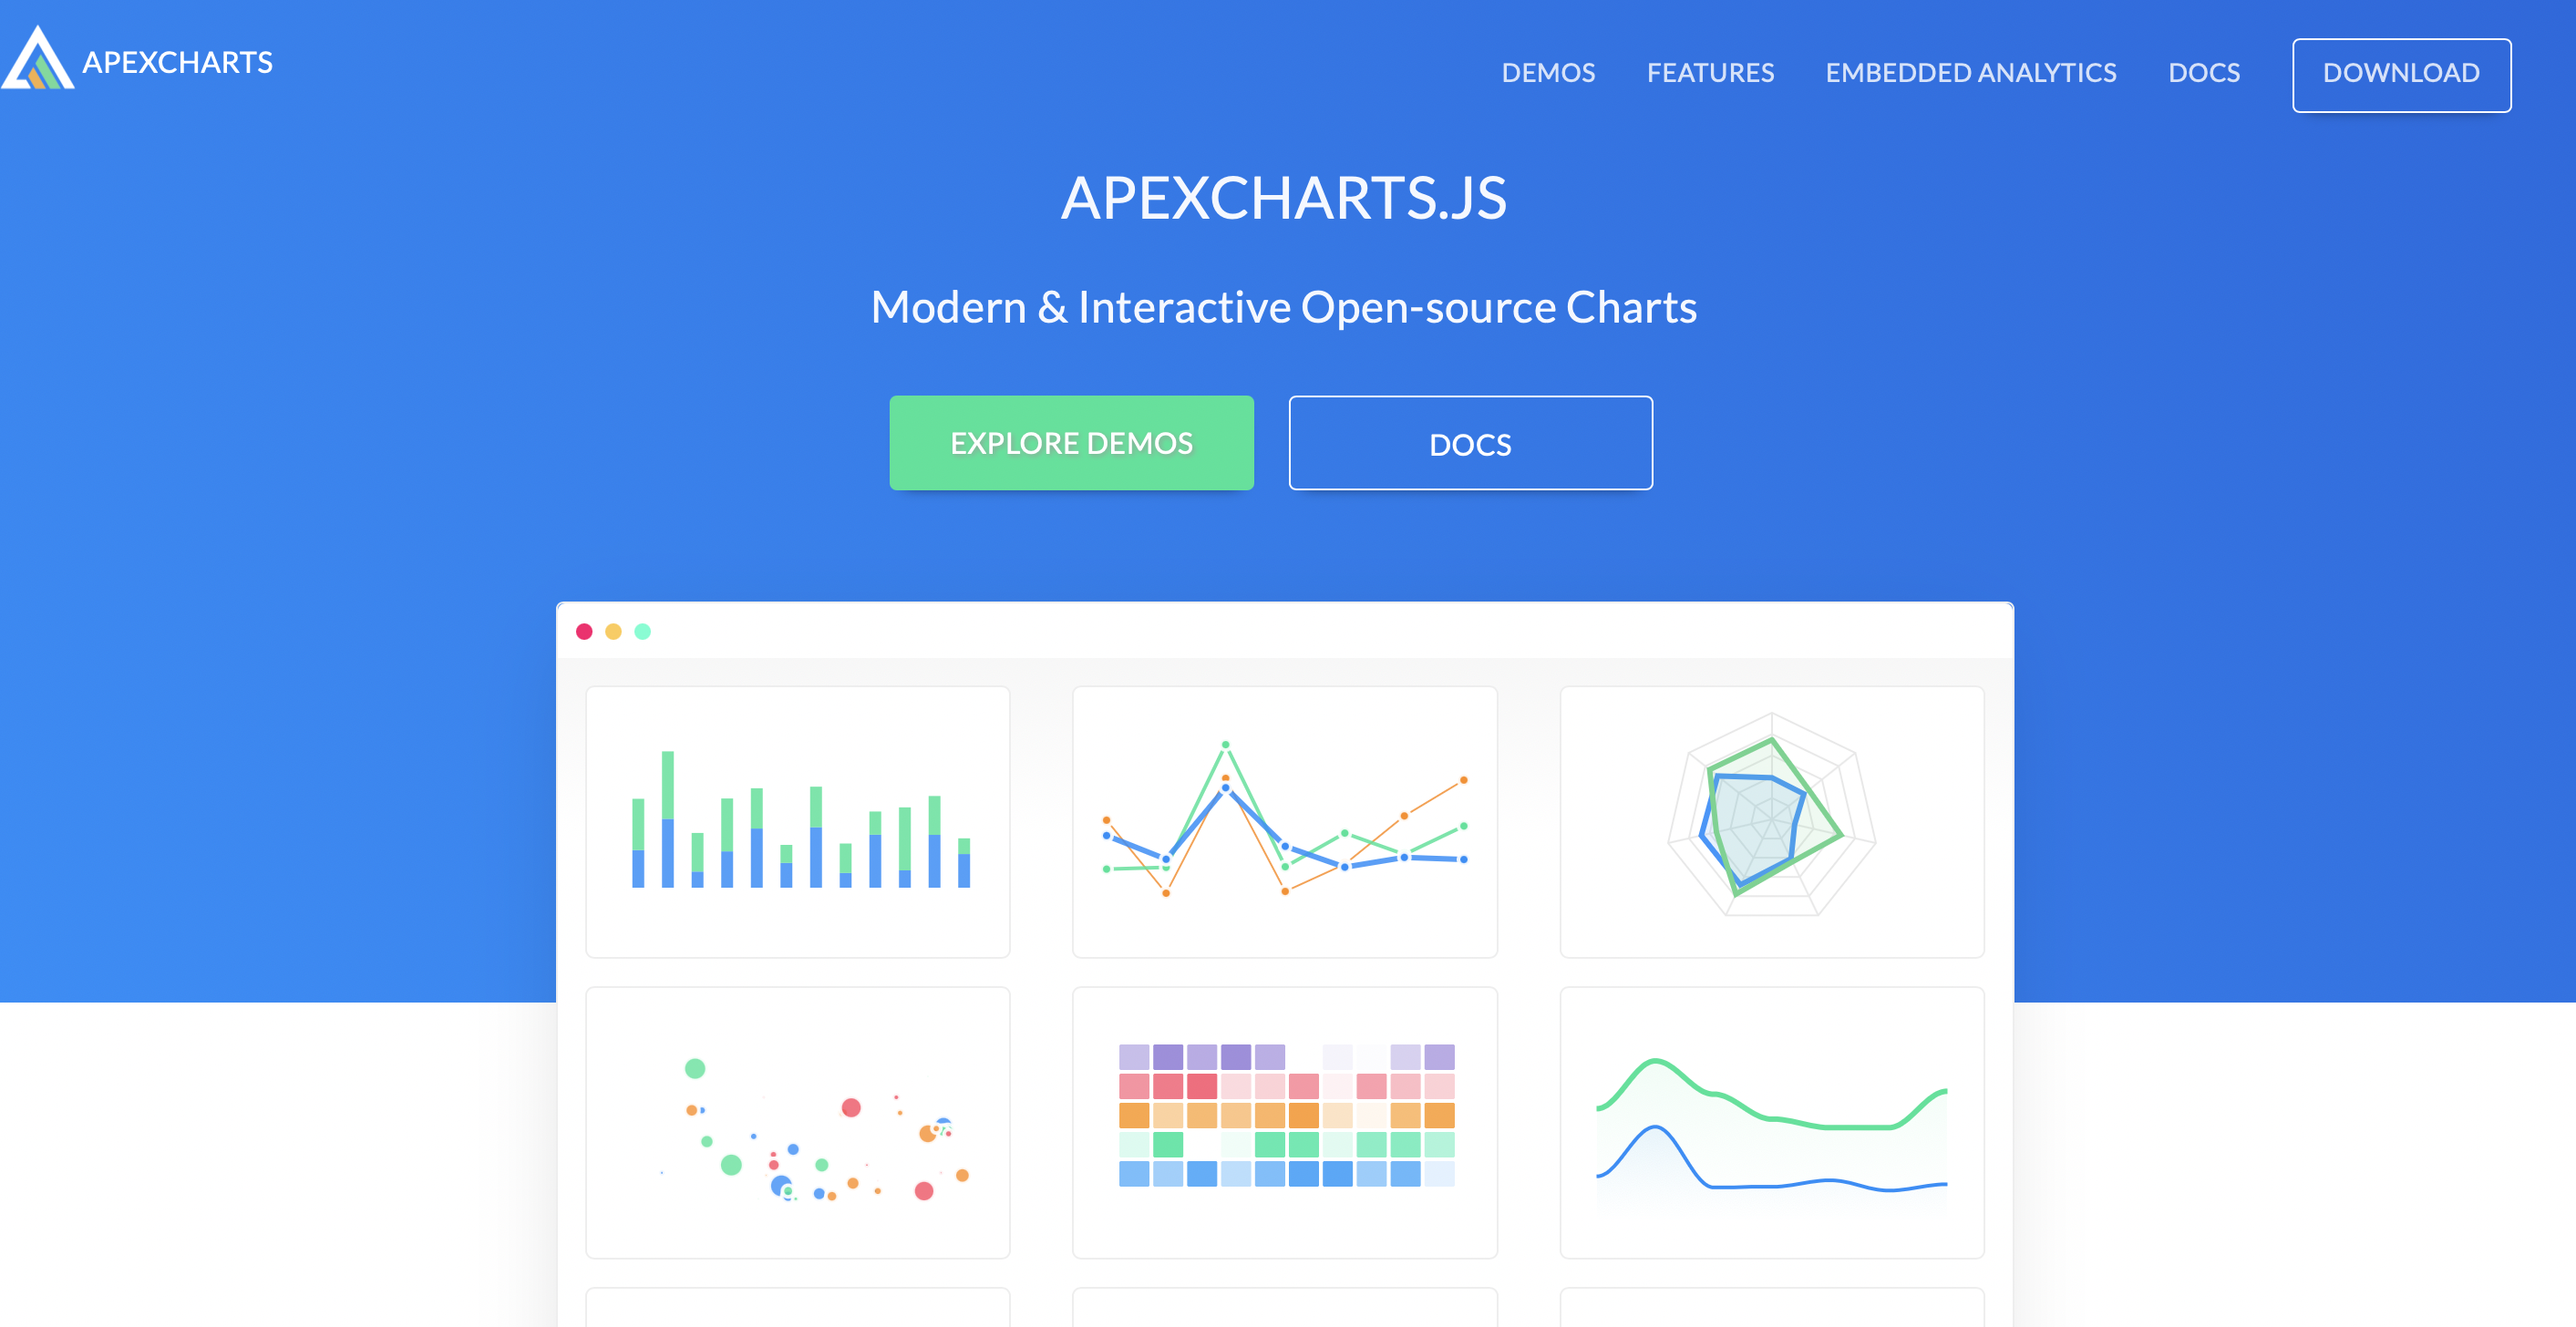
Apexcharts 란?
React 뿐만 아니라 Vanilla js, Angular, Vue에서도 사용 가능한 Chart 그리는 라이브러리이다.
플랫폼이 바뀌더라도 Apexcharts 하나만 배워두면 Chart 라이브러리를 다시 배울 필요 없이 Chart 그릴 수 있다.
다양한 Chart를 그릴 수 있고, Chart 마다 예제 코드를 Vanilla js로 제공을 해준다.

리액트 기초
☝️아직 리액트 기초를 모르신다면, 아래 링크에서 기초를 먼저 보고 오세요.
리액트 시작하기 1 - 설치 및 기본 예제 분석
이 글은 기본적으로 HTML/CSS/Javascript의 기본은 알고 있다는 전제하에 작성되어 있습니다. 잘은 몰라도 되지만 어느 정도 기본 개념은 알고는 있어야 이해하기 쉽습니다. 💾node js 설치 React를 사용
jaegeun.tistory.com
빠르게 리액트에서 Chart 그리기
그럼 바로 React에서 Apexcharts를 그려보자.
여기 나오는 예제 하나를 따라 해 보면 나머지는 공식 홈페이지에 있는 예제 코드를 이용하여 혼자 구현할 수 있다.
apexcharts 설치
> npm install apexcharts
> npm install react-apexcharts
apexcharts import
import 한 ApexCharts는 리액트 Component로 사용하면 된다.
import ApexCharts from 'react-apexcharts'
코드 작성
App Component에서 import 한 ApexCharts Component를 사용해보자.
import { Component } from 'react'
import ApexCharts from 'react-apexcharts'

export default class App extends Component {
  constructor(props) {
    super(props);

    this.state = {
      series: [{
        name: "Desktops",
        data: [10, 41, 35, 51, 49, 62, 69, 91, 148]
      },
      {
        name: "Data2",
        data: [1, 4, 15, 41, 69, 32, 39, 31, 48]
      }],

      options: {
        chart: {
          zoom: {
            enabled: false
          }
        },
        dataLabels: {
          enabled: false
        },
        stroke: {
          curve: 'straight'
        },
        title: {
          text: 'Product Trends by Month',
          align: 'left'
        },
        grid: {
          row: {
            colors: ['#f3f3f3f3', 'transparent'], // takes an array which will be repeated on columns
            opacity: 0.5
          },
        },
        xaxis: {
          categories: ['Jan', 'Feb', 'Mar', 'Apr', 'May', 'Jun', 'Jul', 'Aug', 'Sep'],
        }
      }
    }
  }
  render() {
    return (
      <ApexCharts
        options={this.state.options}
        series={this.state.series}
        typs='line'
        width={500}
        height={300}
        />
    );
  }
}
ApexCharts Component에 props로 options, series, types, width, height 등 을 넣어준다
props의 값들을 바꿔보며 자신이 원하는 차트로 더 수정을 할 수 있다. 자세한 props들에 대한 설명은 공식 사이트를 참고하자.
다른 차트를 그리고 싶으면 공식 사이트에 있는 Vanilla js 코드를 위의 예제 코드와 비슷하게 수정해준다.

'개발 > React' 카테고리의 다른 글
| 리액트 투두앱 간단하게 만들기 - 10분만에 (0) | 2021.10.16 |
|---|---|
| 리액트 시작하기 2 - Component로 기본 끝내기 (0) | 2021.10.16 |
| 리액트 시작하기 1 - 설치 및 기본 예제 분석 (0) | 2021.10.12 |